eunice_uk_24hr
A cross-section of atmospheric data. Colormap: viridis.
Cross-sections of the invisible.
Cross-sections of severe weather systems and historic storms.
A cross-section of atmospheric data. Colormap: viridis.
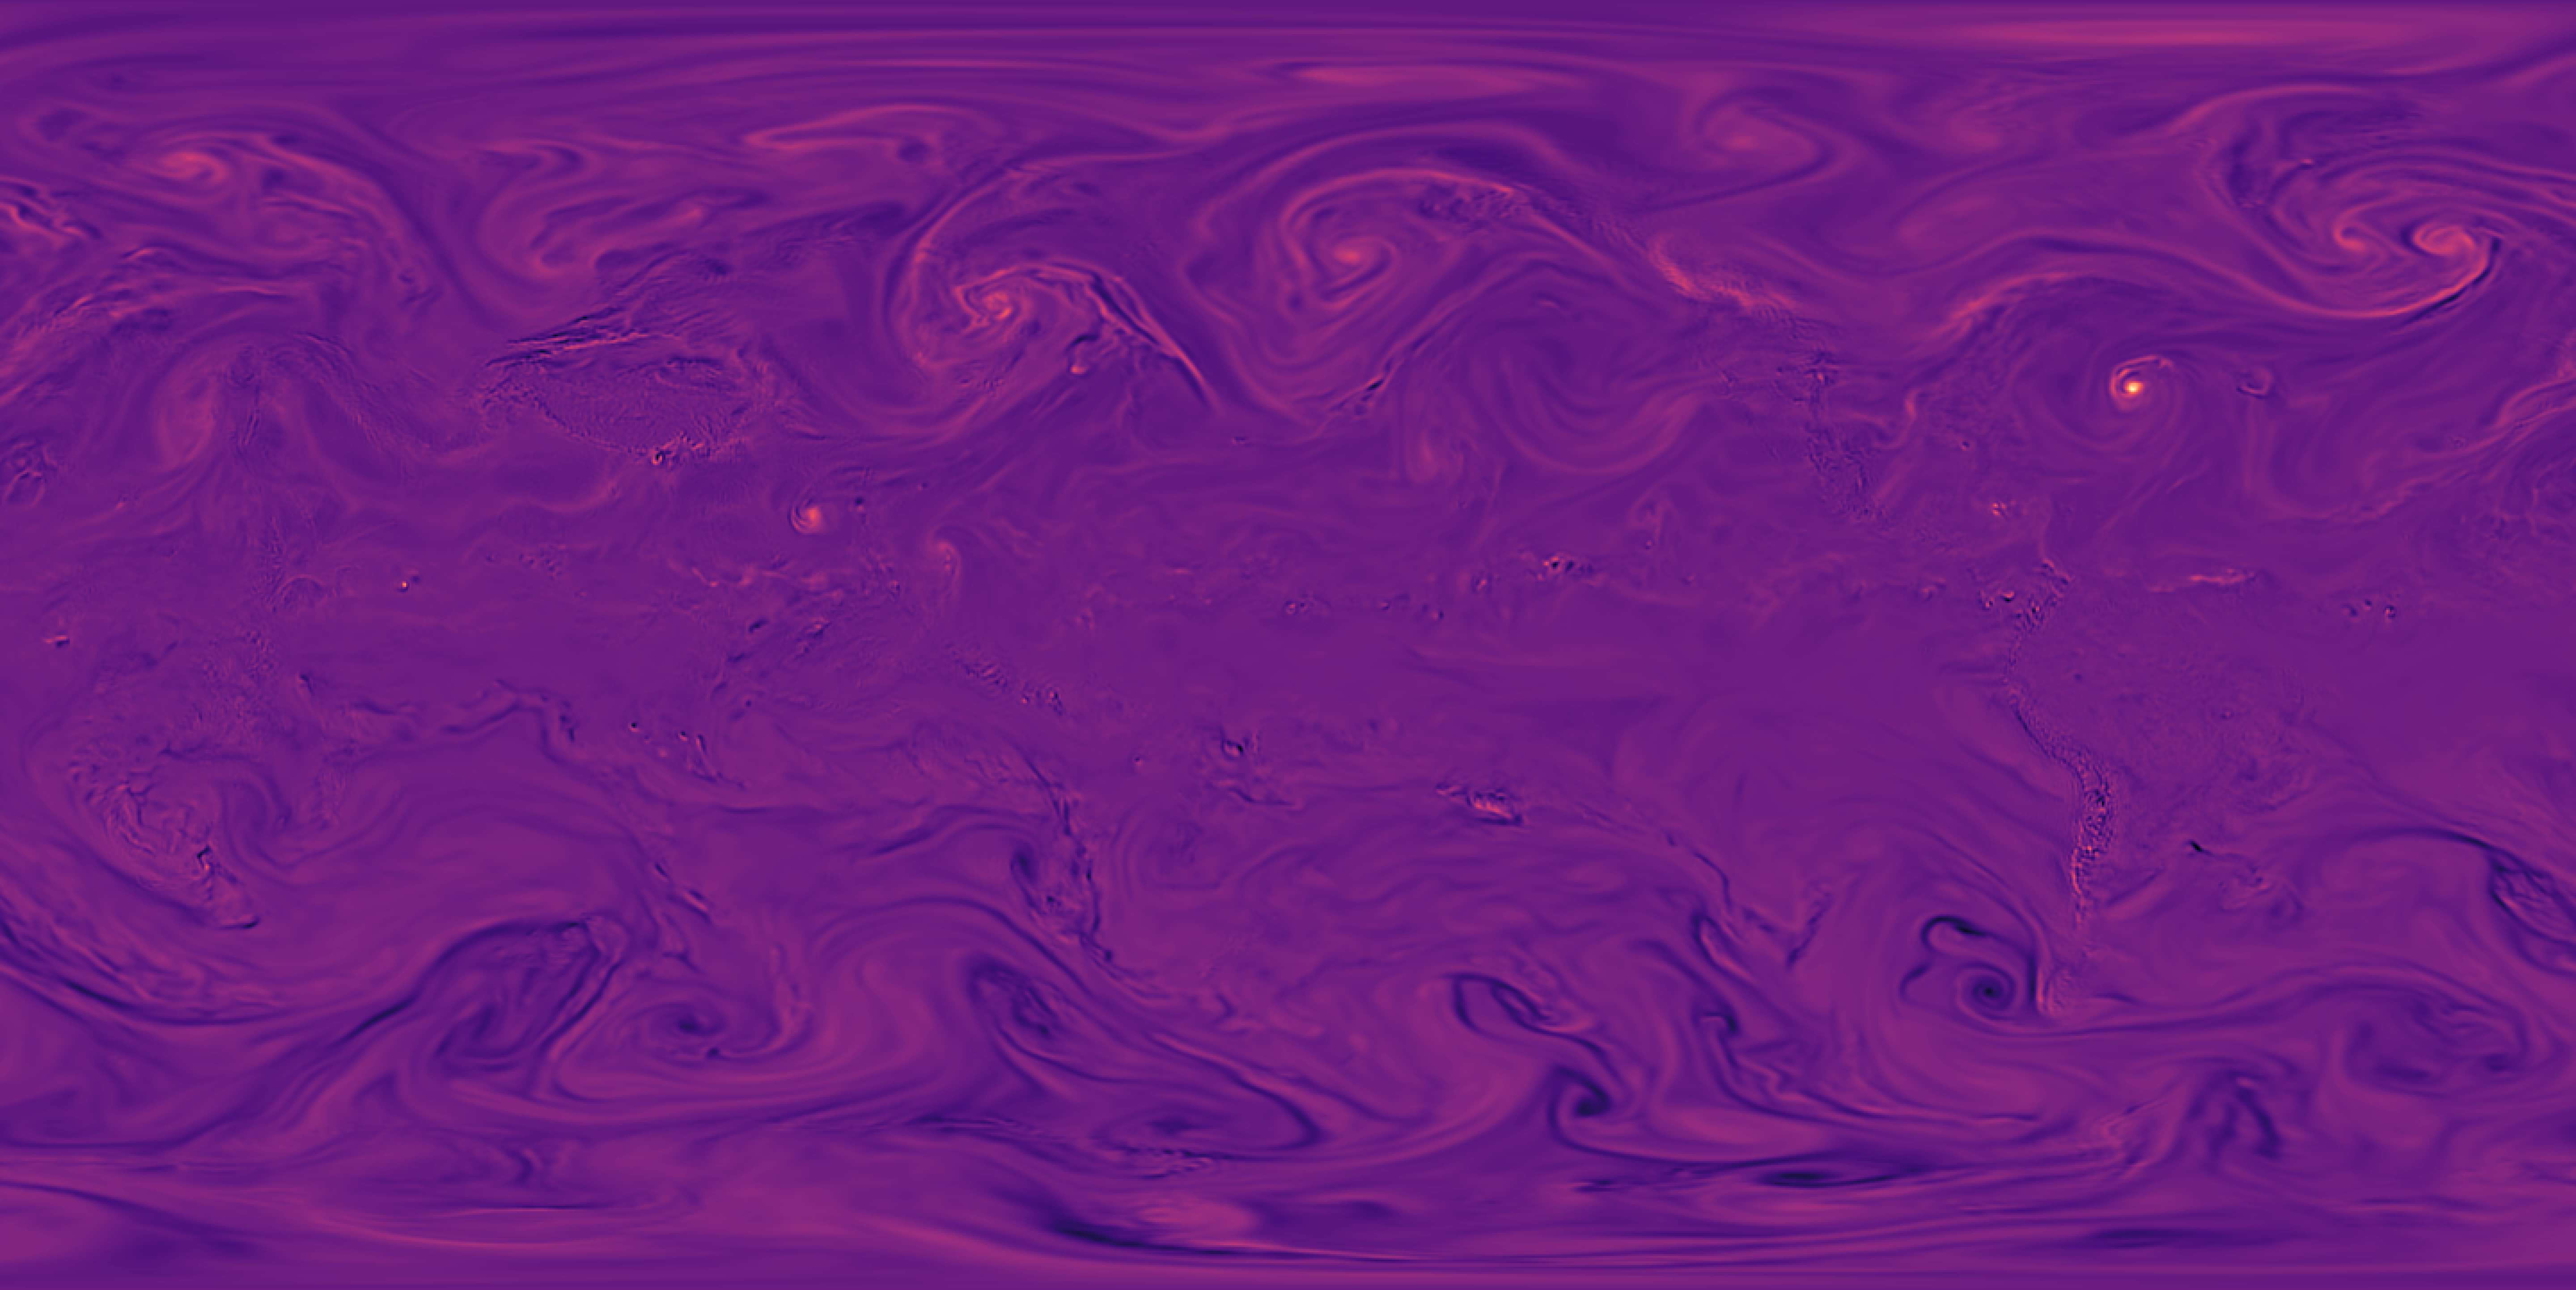
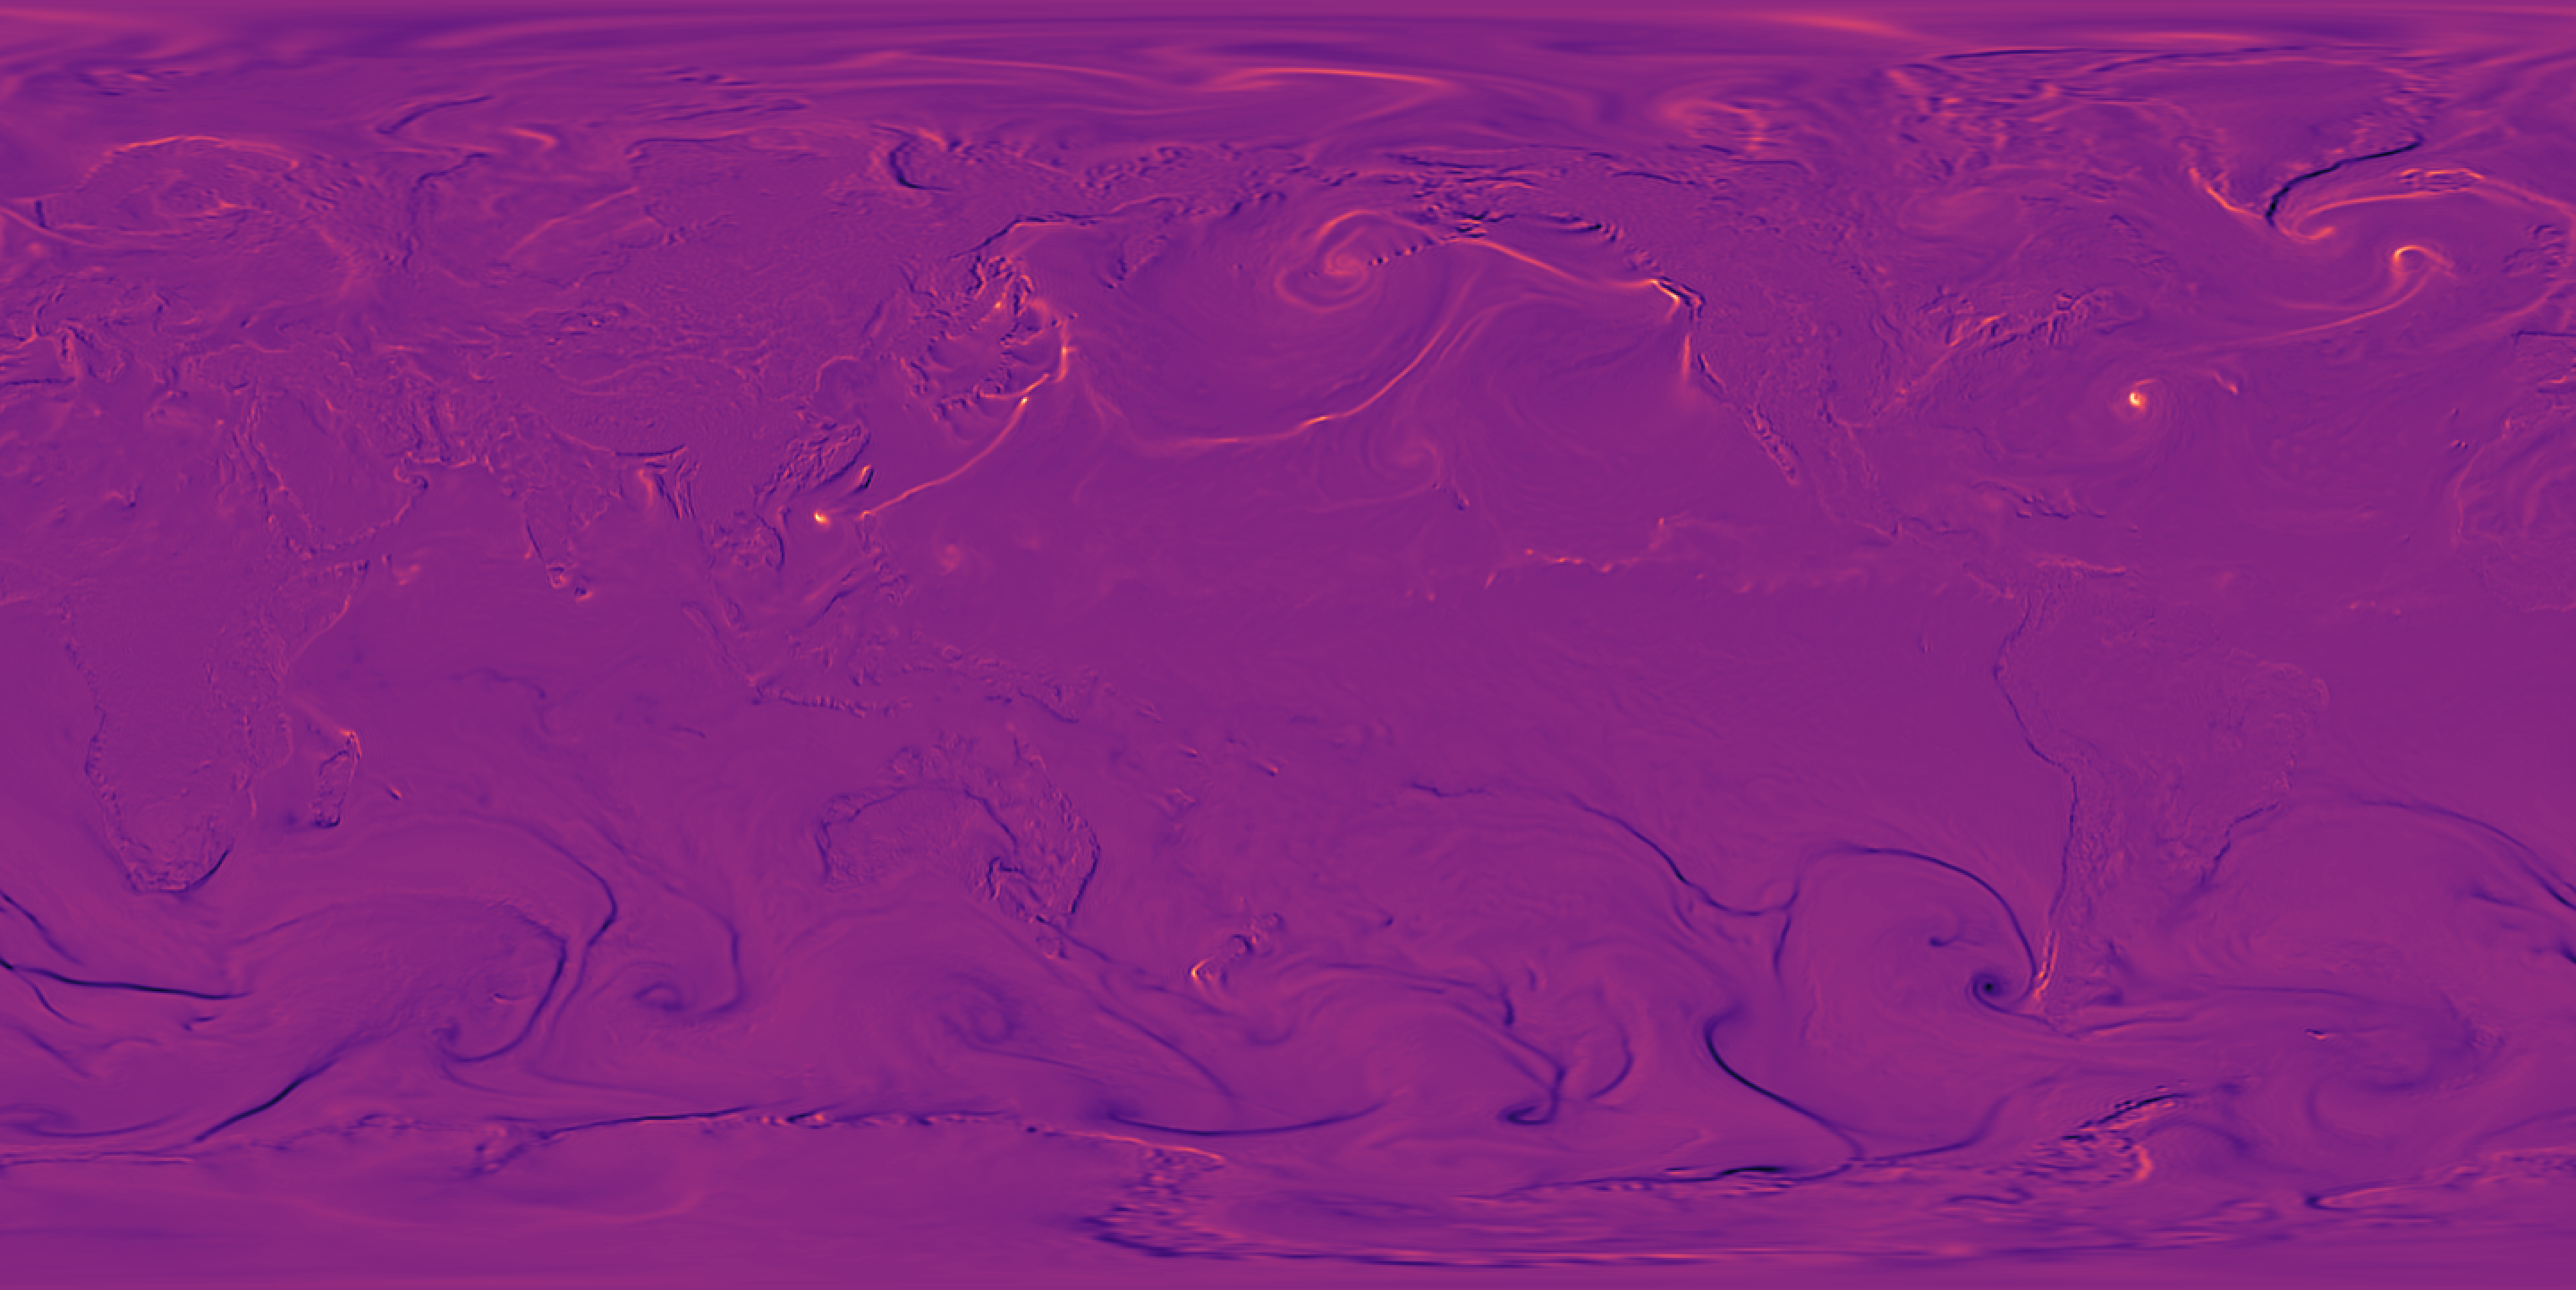
Atmospheric slice showing relative vorticity (turbulence) at the 600.0hPa pressure level. Rendered along the Z-axis using the magma colormap.
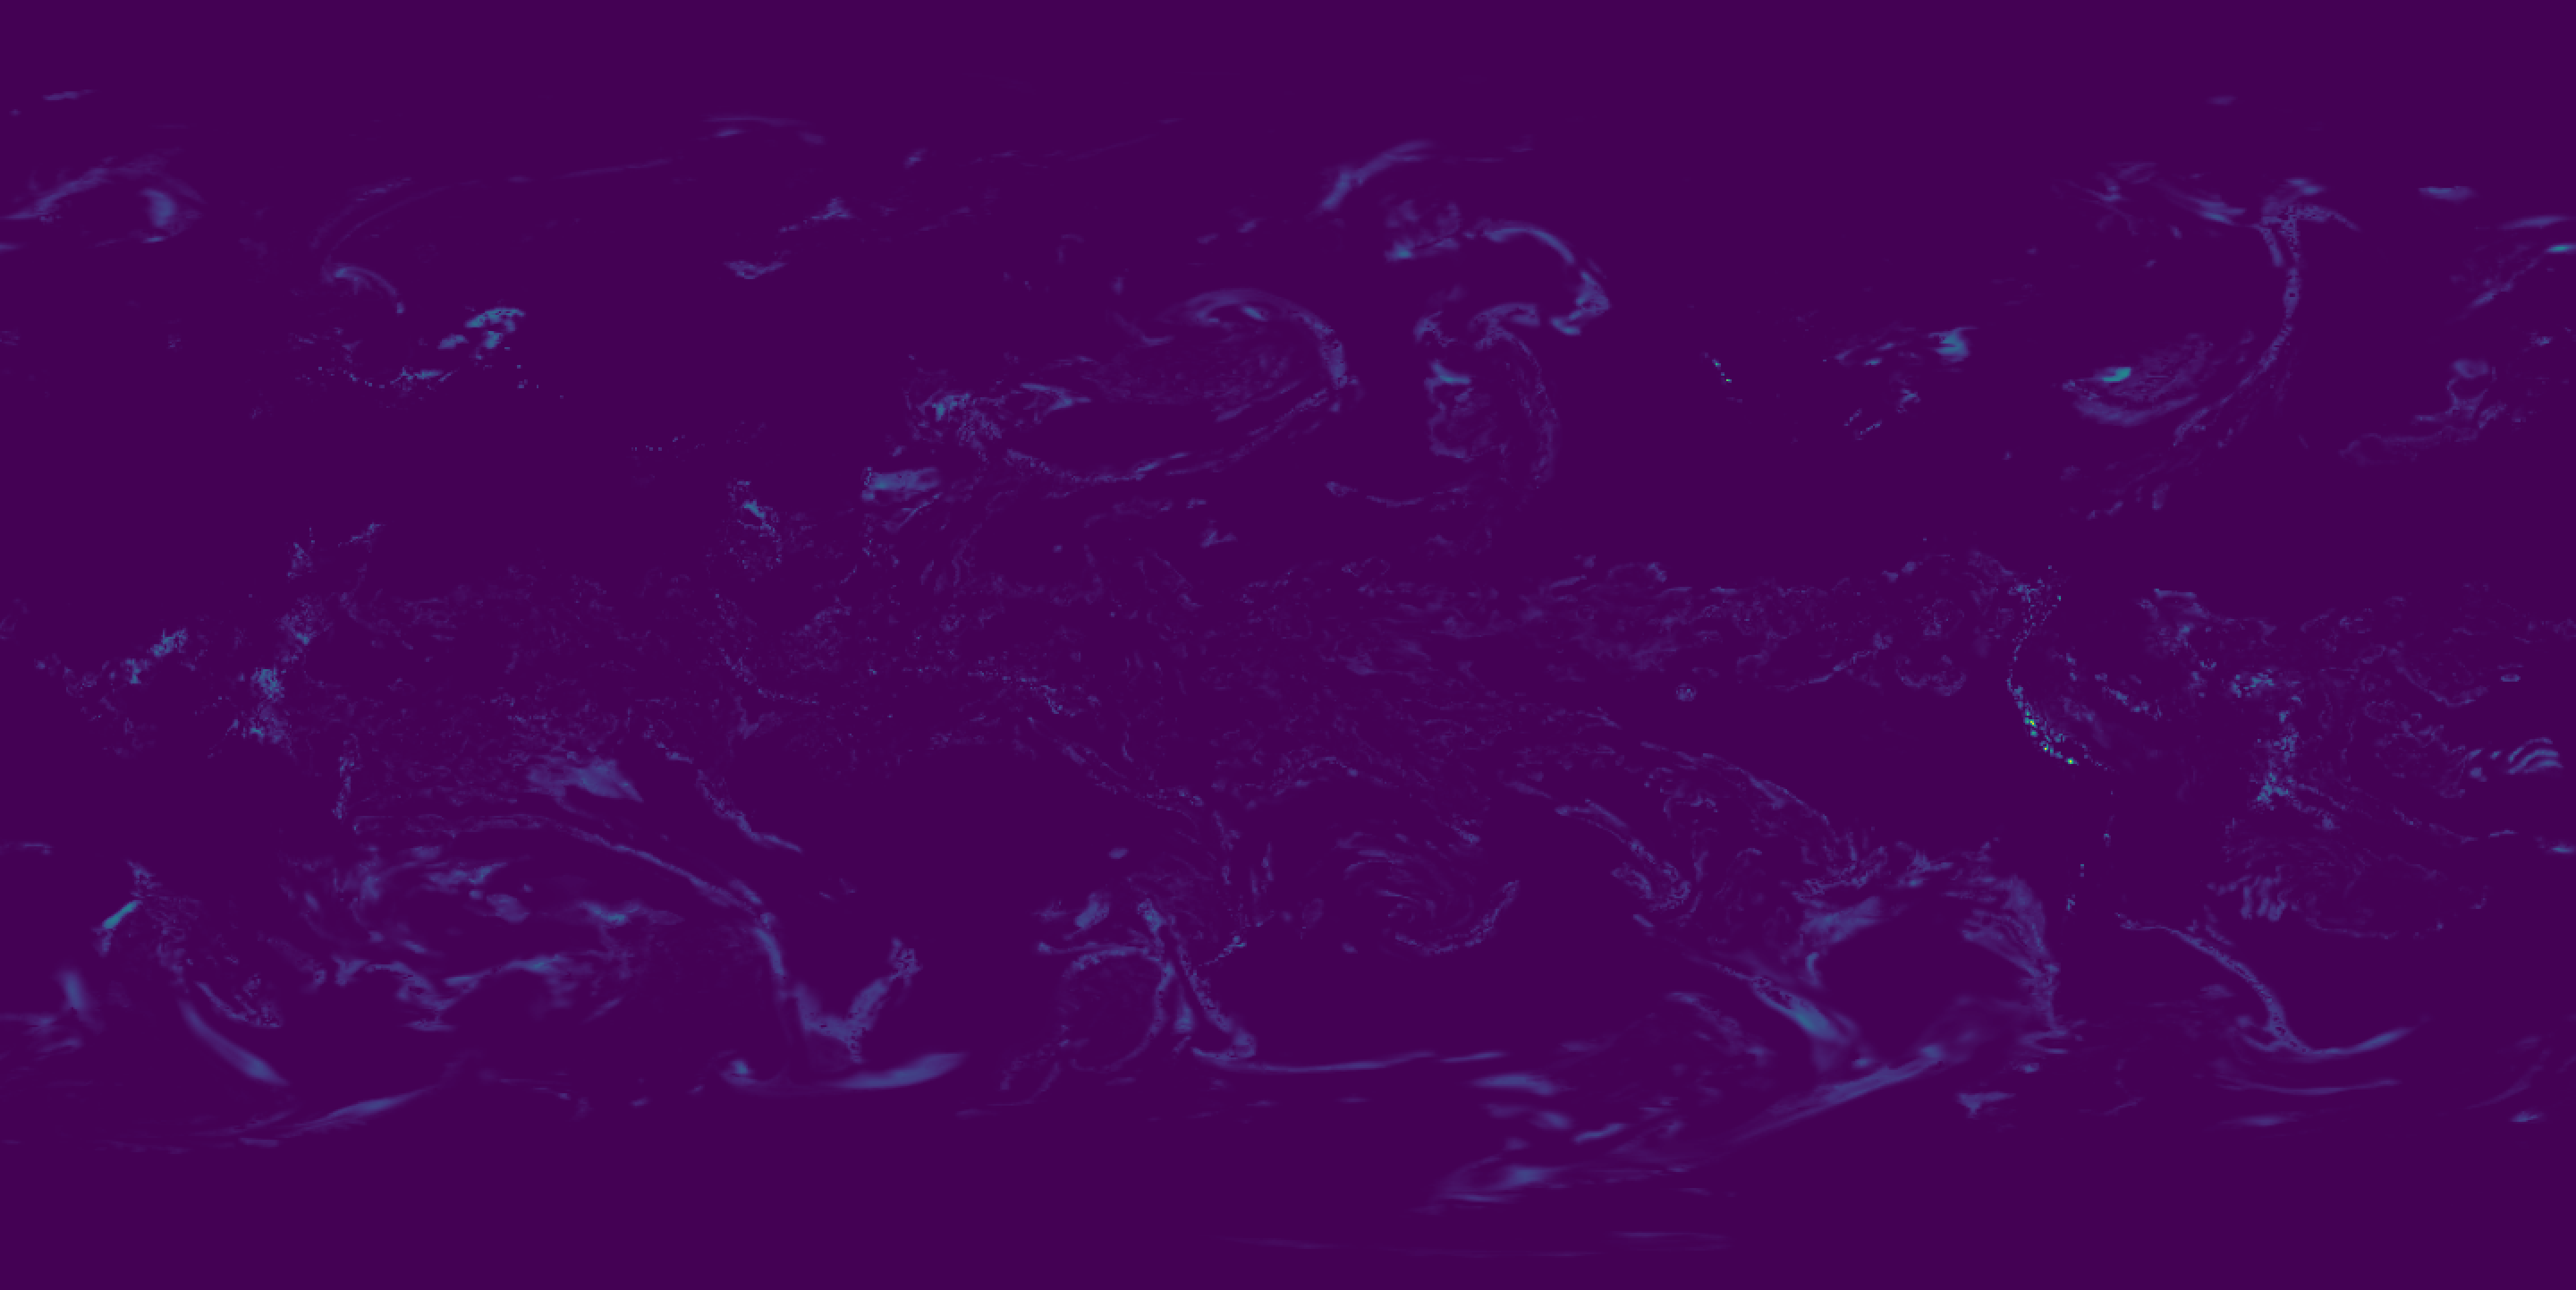
Atmospheric slice showing clwc at the 800.0hPa pressure level. Rendered along the Z-axis using the viridis colormap.
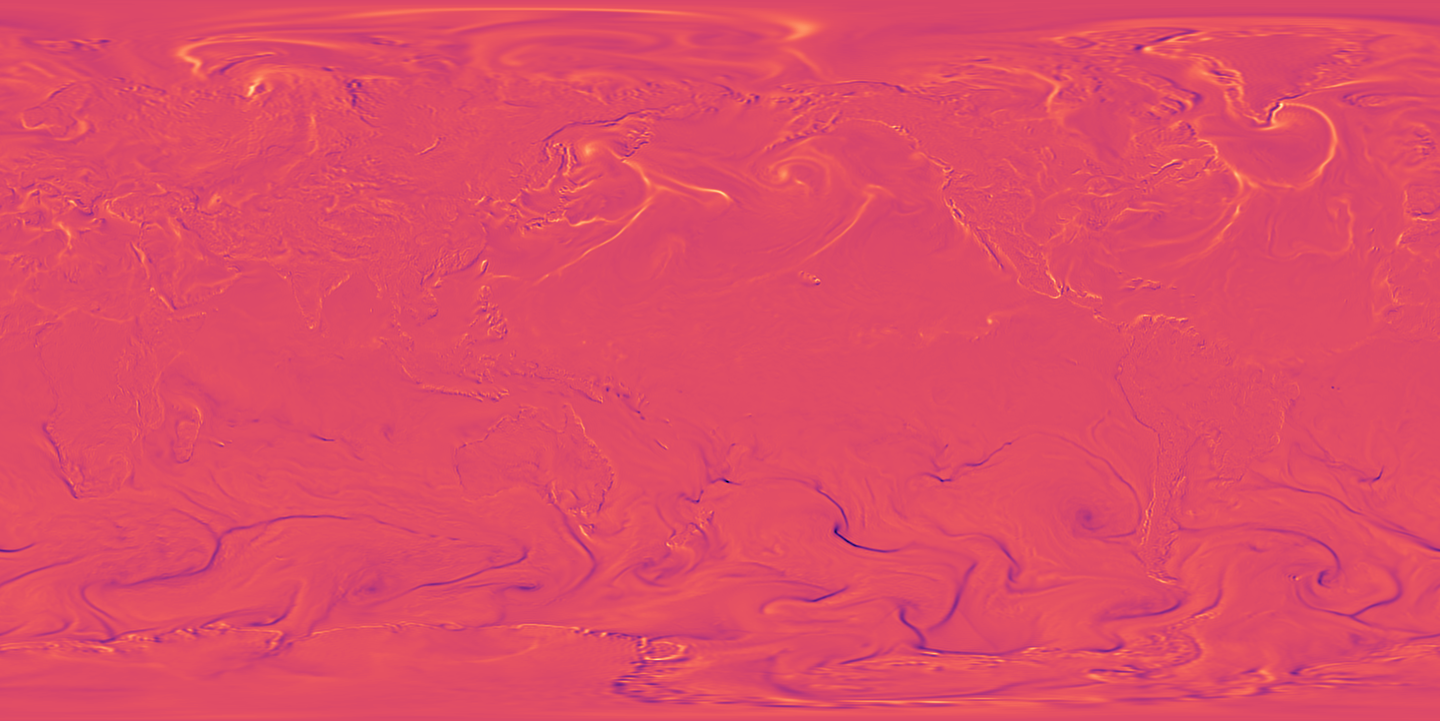
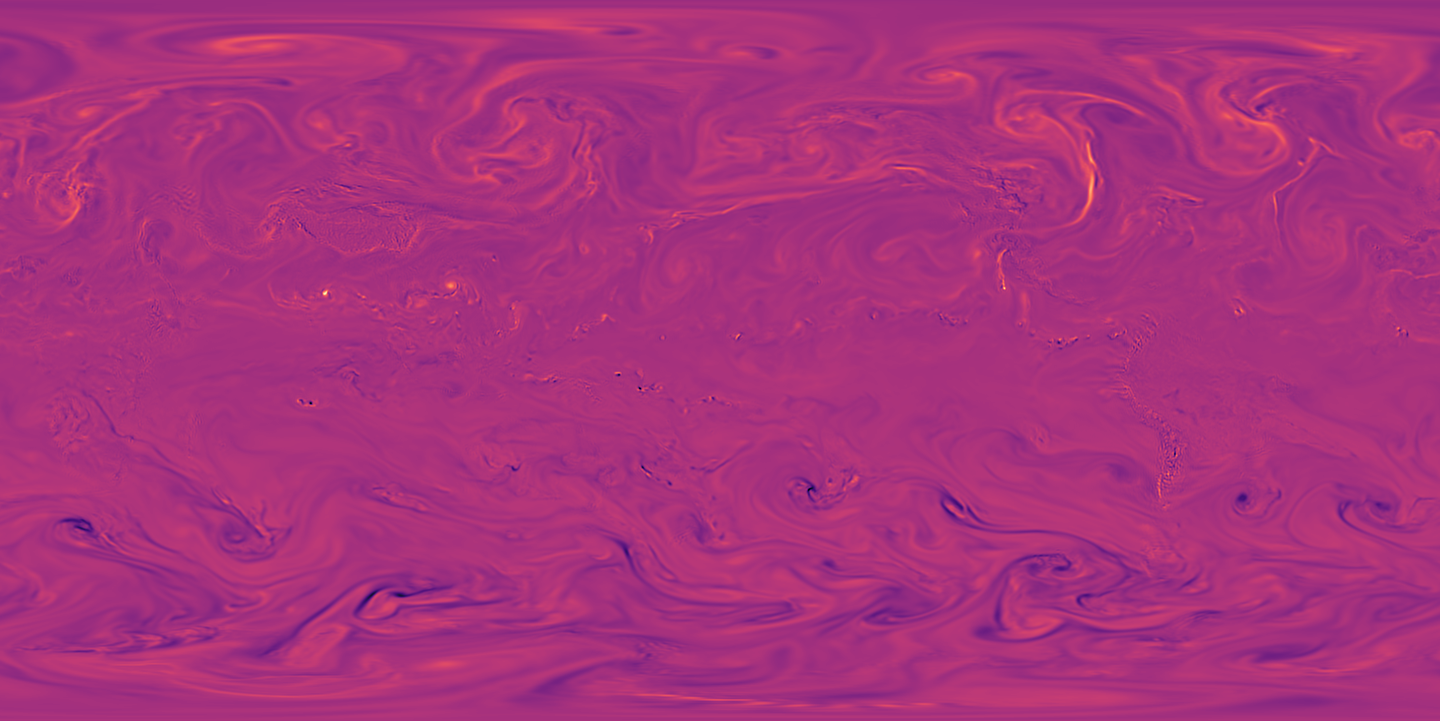
Atmospheric slice showing relative vorticity (turbulence) at the 975.0hPa pressure level. Rendered along the Z-axis using the magma colormap.
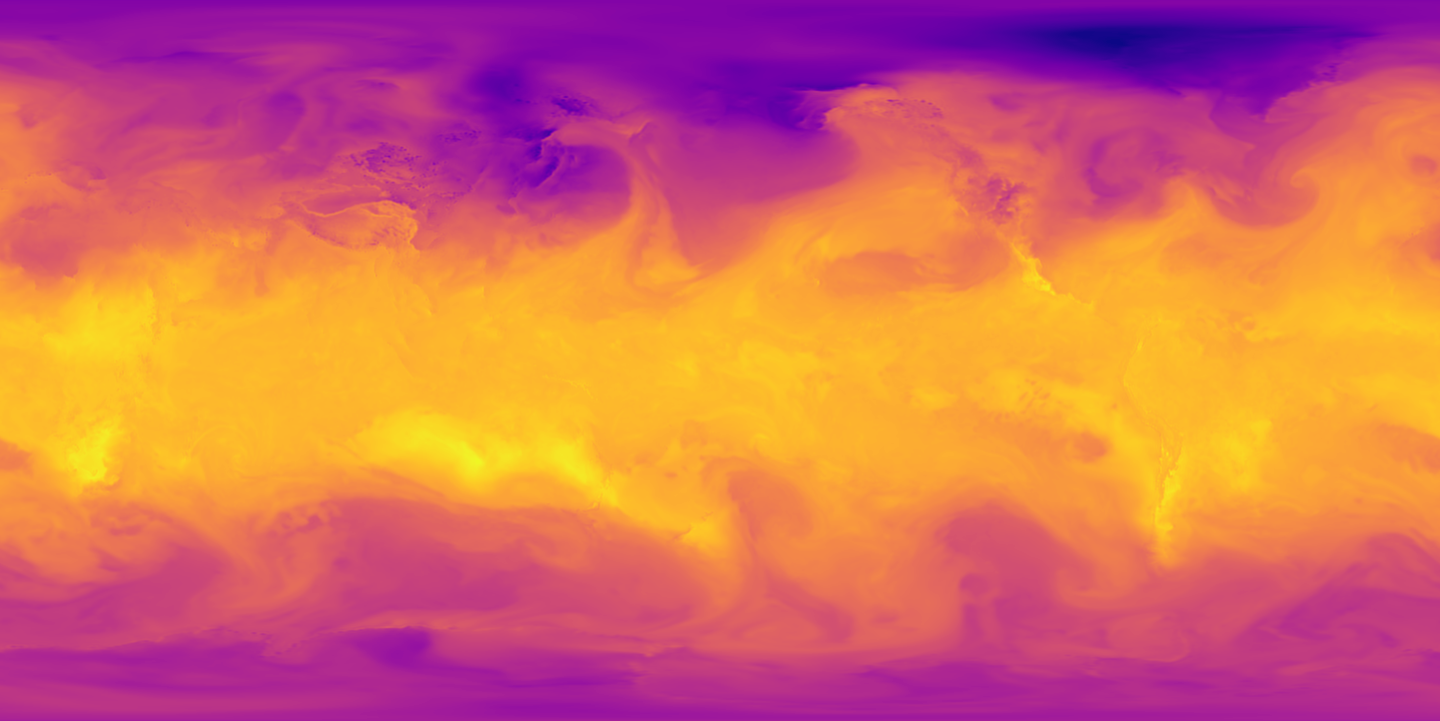
Atmospheric slice showing temperature at the 850hPa pressure level. Rendered along the Z-axis using the plasma colormap.
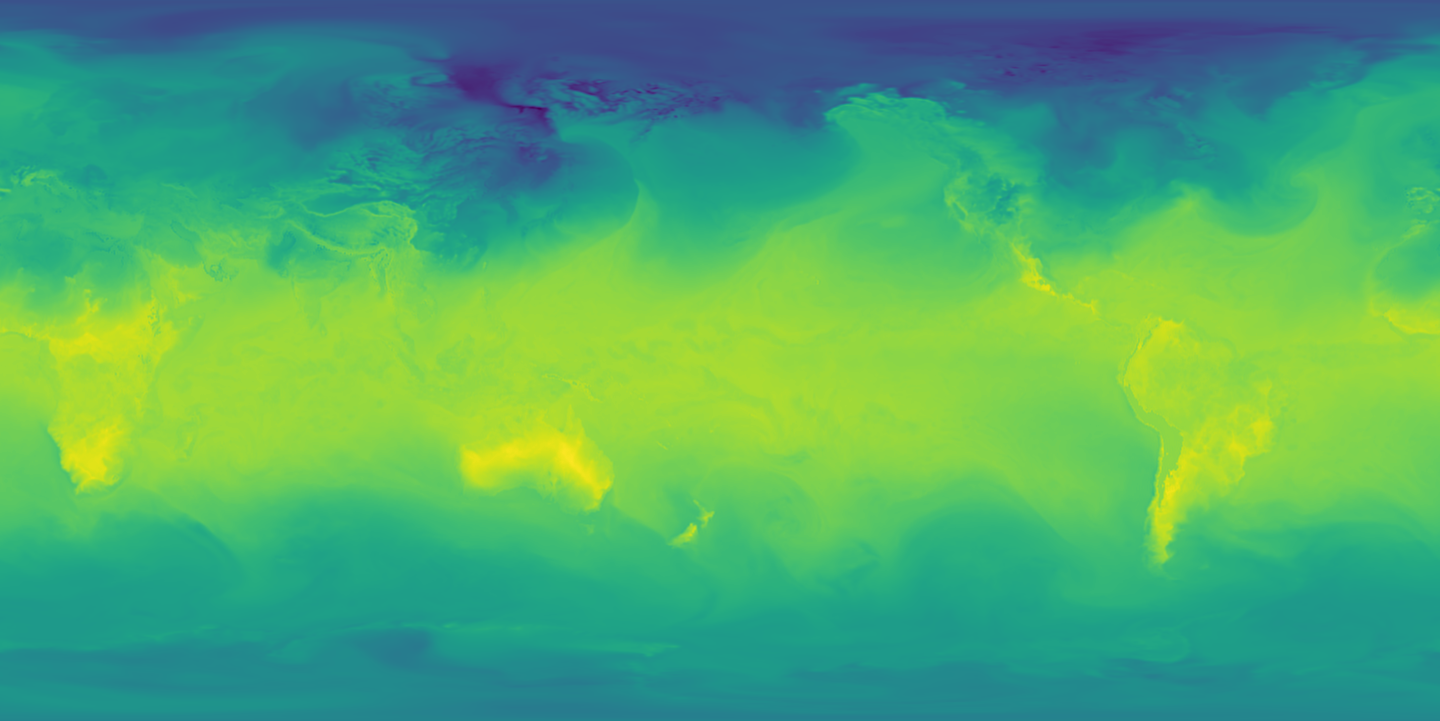
Atmospheric slice showing temperature at the 1000hPa pressure level. Rendered along the Z-axis using the viridis colormap.
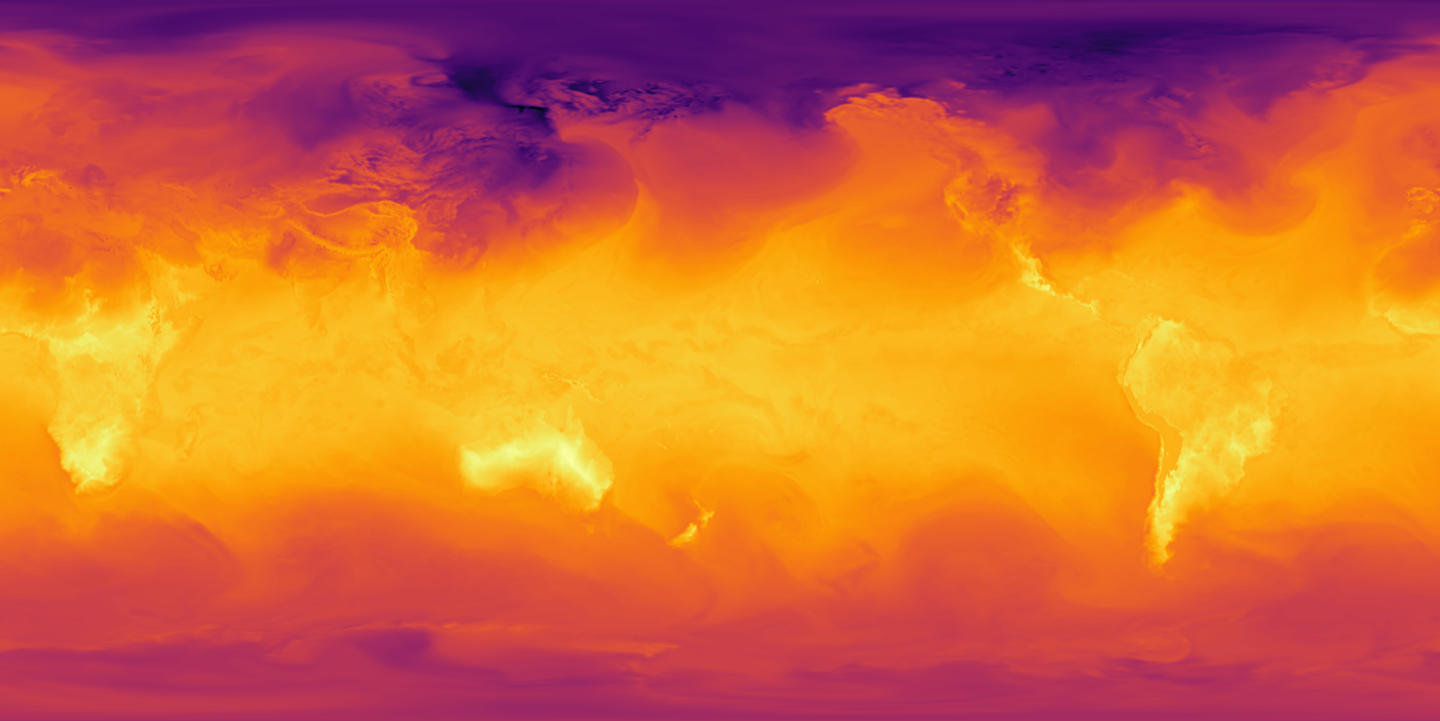
Atmospheric slice showing temperature at the 1000hPa pressure level. Rendered along the Z-axis using the inferno colormap.
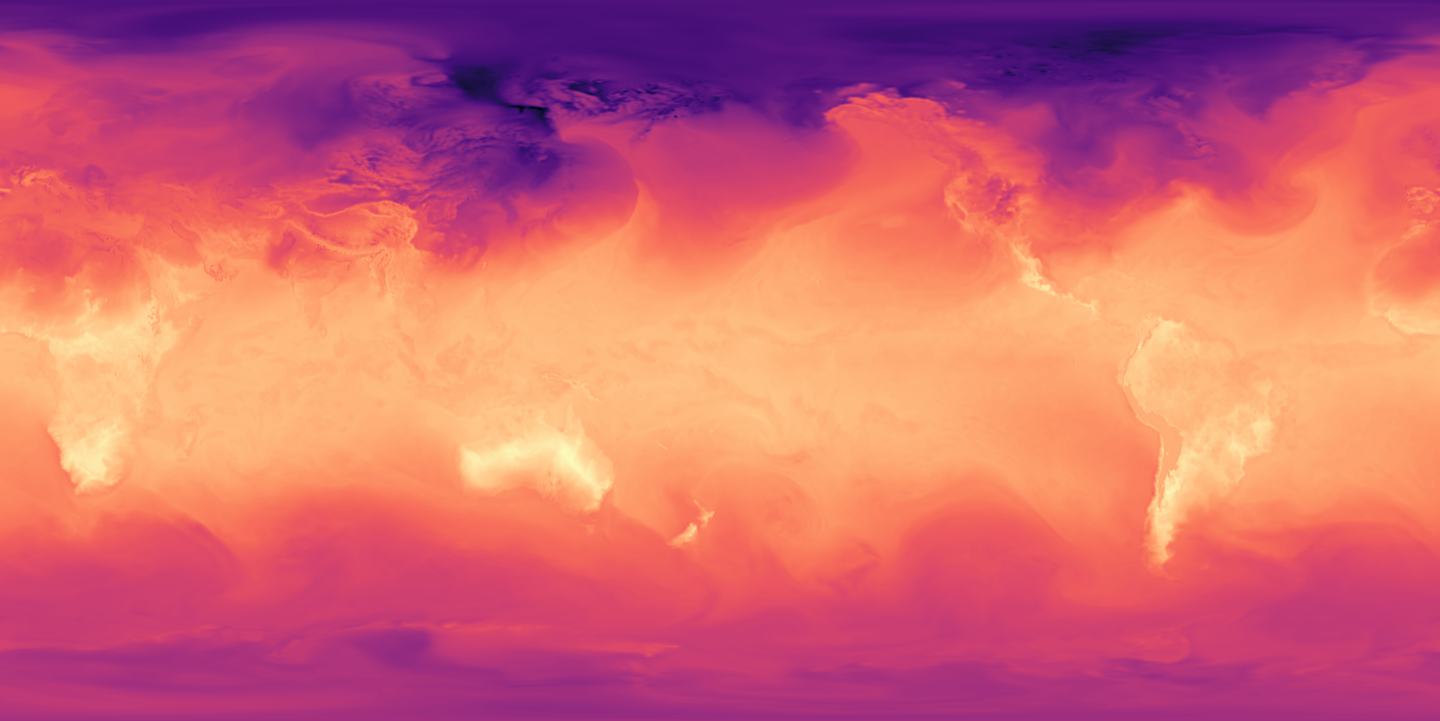
Atmospheric slice showing temperature at the 1000hPa pressure level. Rendered along the Z-axis using the magma colormap.
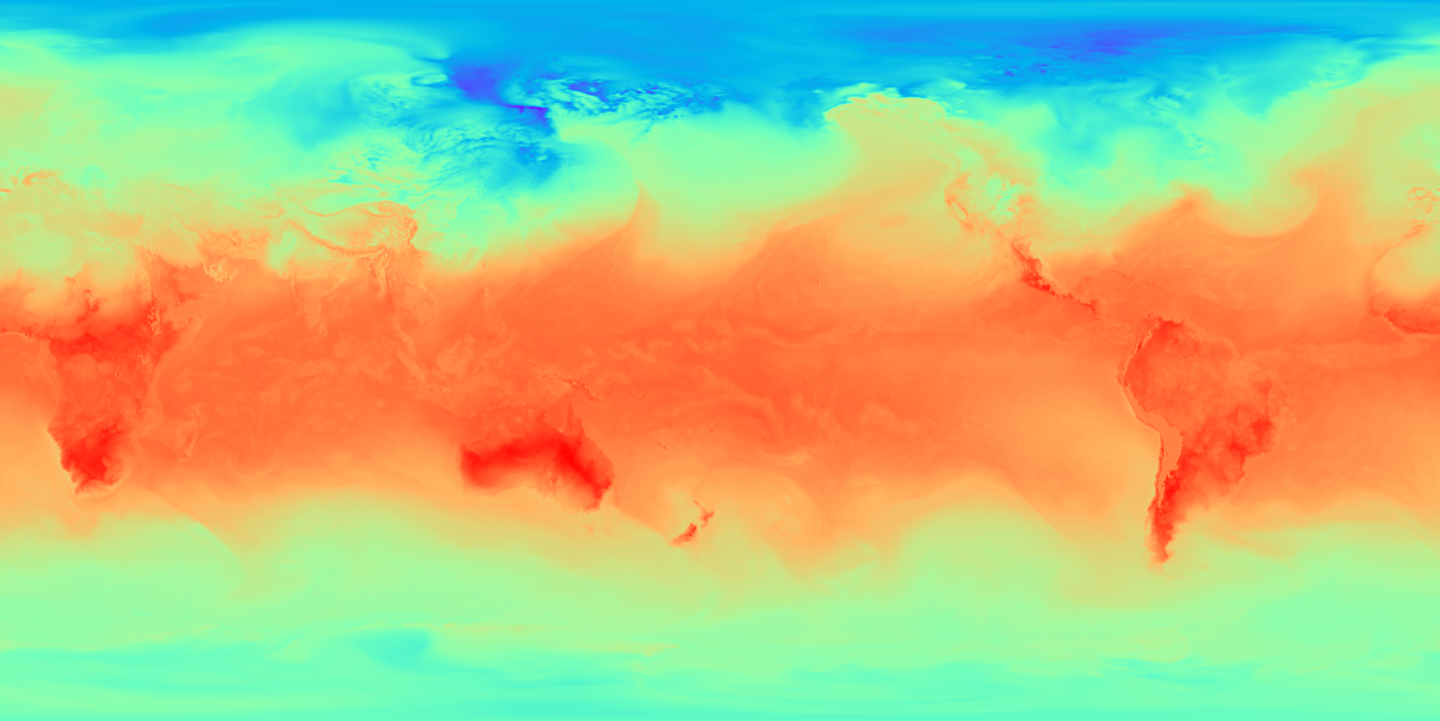
Atmospheric slice showing temperature at the 1000hPa pressure level. Rendered along the Z-axis using the turbo colormap.
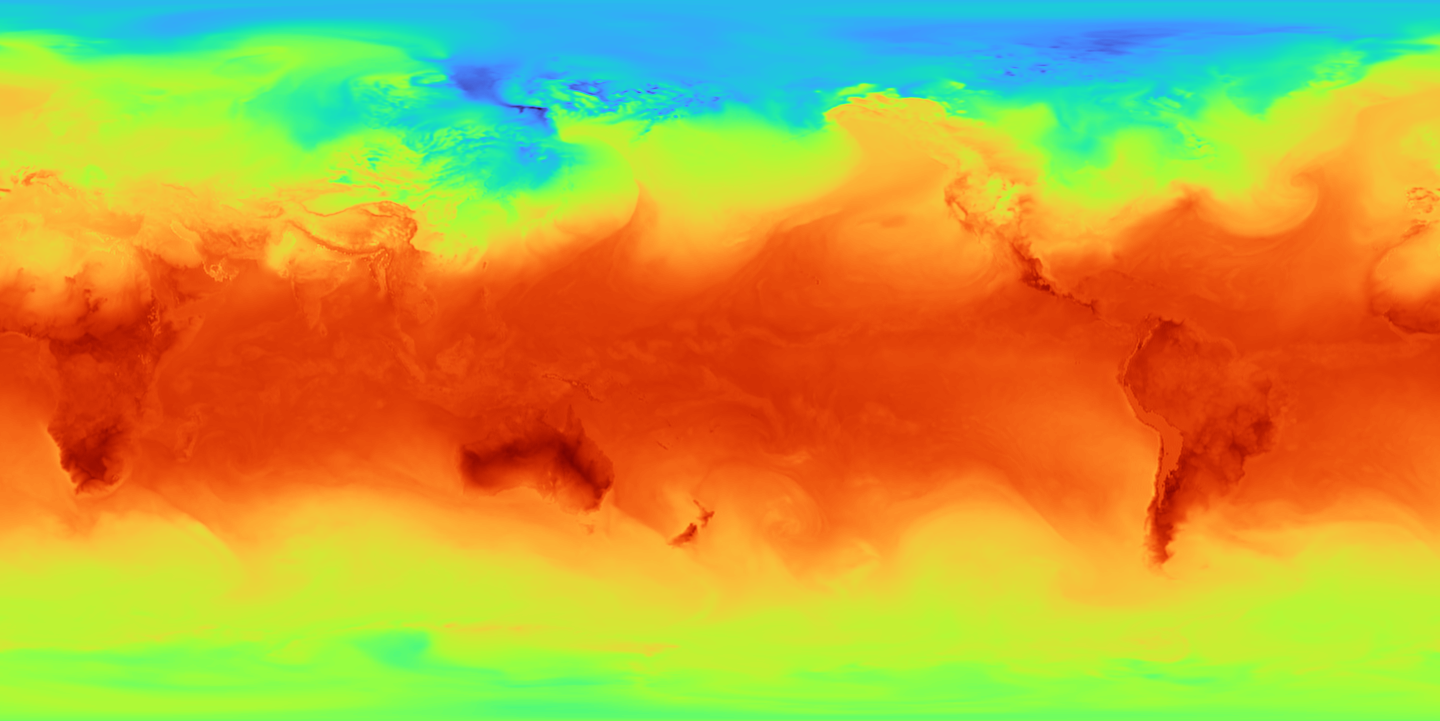
Atmospheric slice showing temperature at the 1000hPa pressure level. Rendered along the Z-axis using the rainbow colormap.
Atmospheric slice showing relative vorticity (turbulence) at the 975.0hPa pressure level. Rendered along the Z-axis using the magma colormap.
Atmospheric slice showing relative vorticity (turbulence) at the 600.0hPa pressure level. Rendered along the Z-axis using the magma colormap.
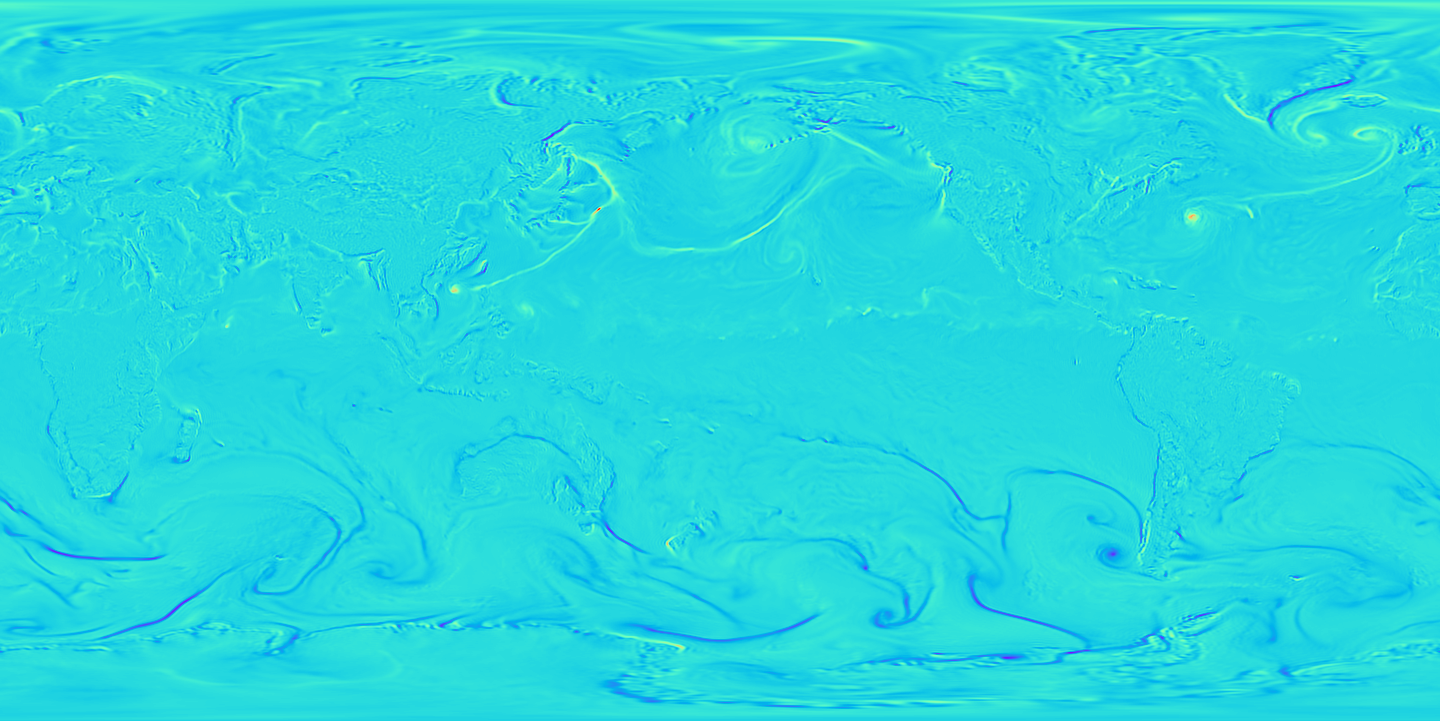
Atmospheric slice showing relative vorticity (turbulence) at the 975.0hPa pressure level. Rendered along the Z-axis using the rainbow colormap.

The 2022 Red Warning storm. The Oracle HUD tracks the development of the sting jet that caused record-breaking gusts.

The 'Michael Fish' storm. A masterclass in explosive cyclogenesis, visualized here by the Oracle's Tortoise Brain.

A textbook perfect Category 5 vortex structure as it made landfall in the Gulf Coast. The Oracle highlights the massive eye of the storm.